Recommended Reading List
Contact me via email (a.musah@ucl.ac.uk) if you are having problems securing one or any of these recommended books from the UCL library or elsewhere.
Week 1: Understanding Data
Book: [Theory, Basics] Cetinkaya-Rundel, M., and Hardin, J., 2021, Introduction to Modern Statistics, Section I: Introduction to data, Chapter 1: Hello data, Page(s): 12-22. Source: openintro.org/book/ims.
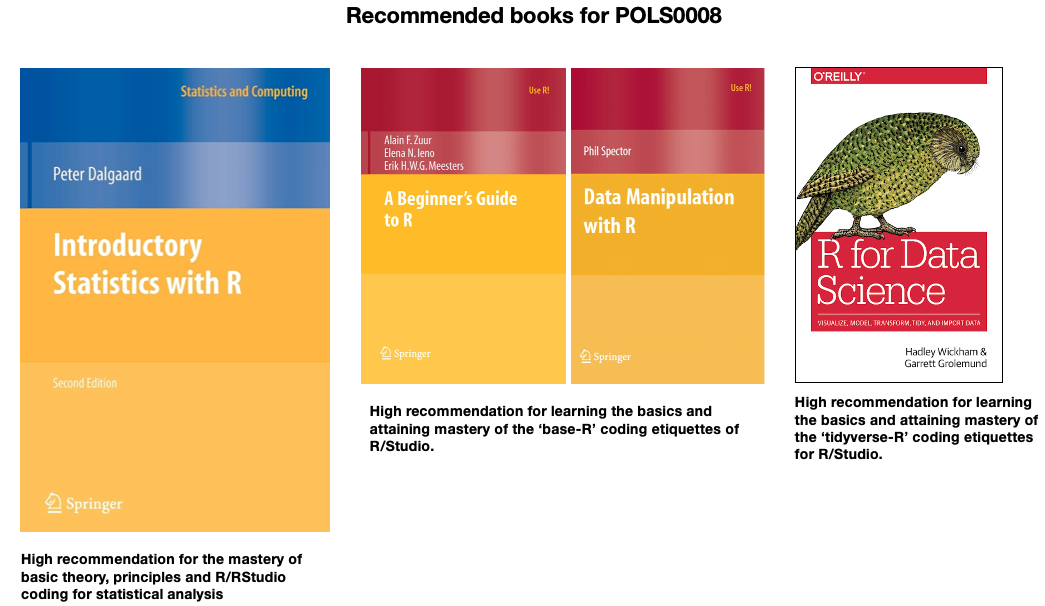
Book: [R-programming, Basics] Dalgaard, P., 2008, Introductory Statistics with R, Chapter 1: Basics, Page(s): 1-28.
Book: [R-programming, Data Management, Basics] Zuur, A.F., Ieno, E.N., & Meesters, E.H.W.G., 2008, A Beginner’s Guide to R, Chapter 2: Getting Data into R, Page(s): 29-54.
Book: [R-programming, Data Management, Basics] Zuur, A.F., Ieno, E.N., & Meesters, E.H.W.G., 2009, A Beginner’s Guide to R, Chapter 3: Accessing Variables and Managing Subsets of Data, Page(s): 57-74.
Week 2: Examining Data I
Book: [Theory, Basics] Cetinkaya-Rundel, M., and Hardin, J., 2021, Introduction to Modern Statistics, Section II: Exploratory data analysis, Chapter 5: Exploring numerical data, Page(s): 76-95. Source: openintro.org/book/ims.
Book: [R-programming, Basics] Dalgaard, P., 2008, Introductory Statistics with R, Chapter 2: Descriptive statistics and graphics, Page(s): 67-93.
Book: [R-programming, Data Management, Basics] Zuur, A.F., Ieno, E.N., & Meesters, E.H.W.G., 2008, A Beginner’s Guide to R, Chapter 2: Getting Data into R, Page(s): 29-54.
Book: [R-programming, Data Management, Basics] Zuur, A.F., Ieno, E.N., & Meesters, E.H.W.G., 2009, A Beginner’s Guide to R, Chapter 3: Accessing Variables and Managing Subsets of Data, Page(s): 57-74.
Book: [R-programming, Generating Graphs, Basics] Zuur, A.F., Ieno, E.N., & Meesters, E.H.W.G., 2009, A Beginner’s Guide to R, Chapter 7: Graphing Tools, Page(s): 127-167.
Week 3: Examining Data II
Book: [R-programming (Base-R code), Generating Graphs, Basics] Zuur, A.F., Ieno, E.N., & Meesters, E.H.W.G., 2009, A Beginner’s Guide to R, Chapter 7: Graphing Tools, Page(s): 127-167.
Book: [R-programming (Base-R code), Basics, Visualisation] Dalgaard, P., 2008, Introductory Statistics with R, Chapter 2: Descriptive statistics and graphics, Page(s): 67-93.
Book: [R-programming (Tidyverse code), Basics, Visualisation] Wickham, H., and Grolemund, G., 2017, R for Data Science, Chapter 1: Data visualisation with ggplot2, Page(s): 3-33.
Book: [Theory, Basics, Graphics] Cetinkaya-Rundel, M., and Hardin, J., 2021, Introduction to Modern Statistics, Section II: Exploratory data analysis, Chapter 4: Exploring categorical data, Page(s): 61-74. Source: openintro.org/book/ims.
Book: [Theory, Basics, Graphics] Cetinkaya-Rundel, M., and Hardin, J., 2021, Introduction to Modern Statistics, Section II: Exploratory data analysis, Chapter 5: Exploring numerical data, Page(s): 76-95. Source: openintro.org/book/ims.
Week 4: Sourcing Data
Article: [R-programming (Tidyverse code), Data Management] Wickham, 2014, Tidy data, Journal of Statistical Software 59(10). [Link]
Book: [R-programming (Tidyverse code), Basics, Data Management] Wickham, H., and Grolemund, G., 2017, R for Data Science, Chapter 3: Data Transformation with dplyr, Page(s): 43-73.
Book: [R-programming (Tidyverse code), Basics, Data Management] Wickham, H., and Grolemund, G., 2017, R for Data Science, Chapter 9: Tidy Data with tidyr, Page(s): 147-168.
Extra notes
For other reading materials beyond what’s mentioned here please read through the Module Outline document [HERE] which also is accessible on Moodle.
To follow the examples with the dataset provided in the book “Introductory Statistics with R”. You will need to install a package called “ISwR”. Here is the code chuck for performing such installation.
# install the ISwR using install.packages() function
install.packages("ISwR")
# active it using library() function
library("ISwR")
# this should allow to use the datasets ‘thuesen’ and ‘eba1977’ to follow the examples in book
# to add data - use the data() function
data("thuesen")
data("eba1977")
# see the datasets
thuesen
eba1977